
LabPlot
#LabPlot is a FREE, #opensource and cross-platform data #visualization and #analysis software accessible to everyone and trusted by professionals.
• High-quality interactive plotting
• Reliable data analysis, statistics, regression, curve and peak fitting
• Computing with interactive Notebooks (Python R Maxima Octave and more)
• Data extraction from plots and support for live data
• Data import and export (many file formats)
• Runs on Windows, macOS, Linux
Partly funded through #NGI Zero Core.
- 19 Posts
- 27 Comments
@coucouf @europesays @labplot@lemmy.kde.social @dataisbeautiful
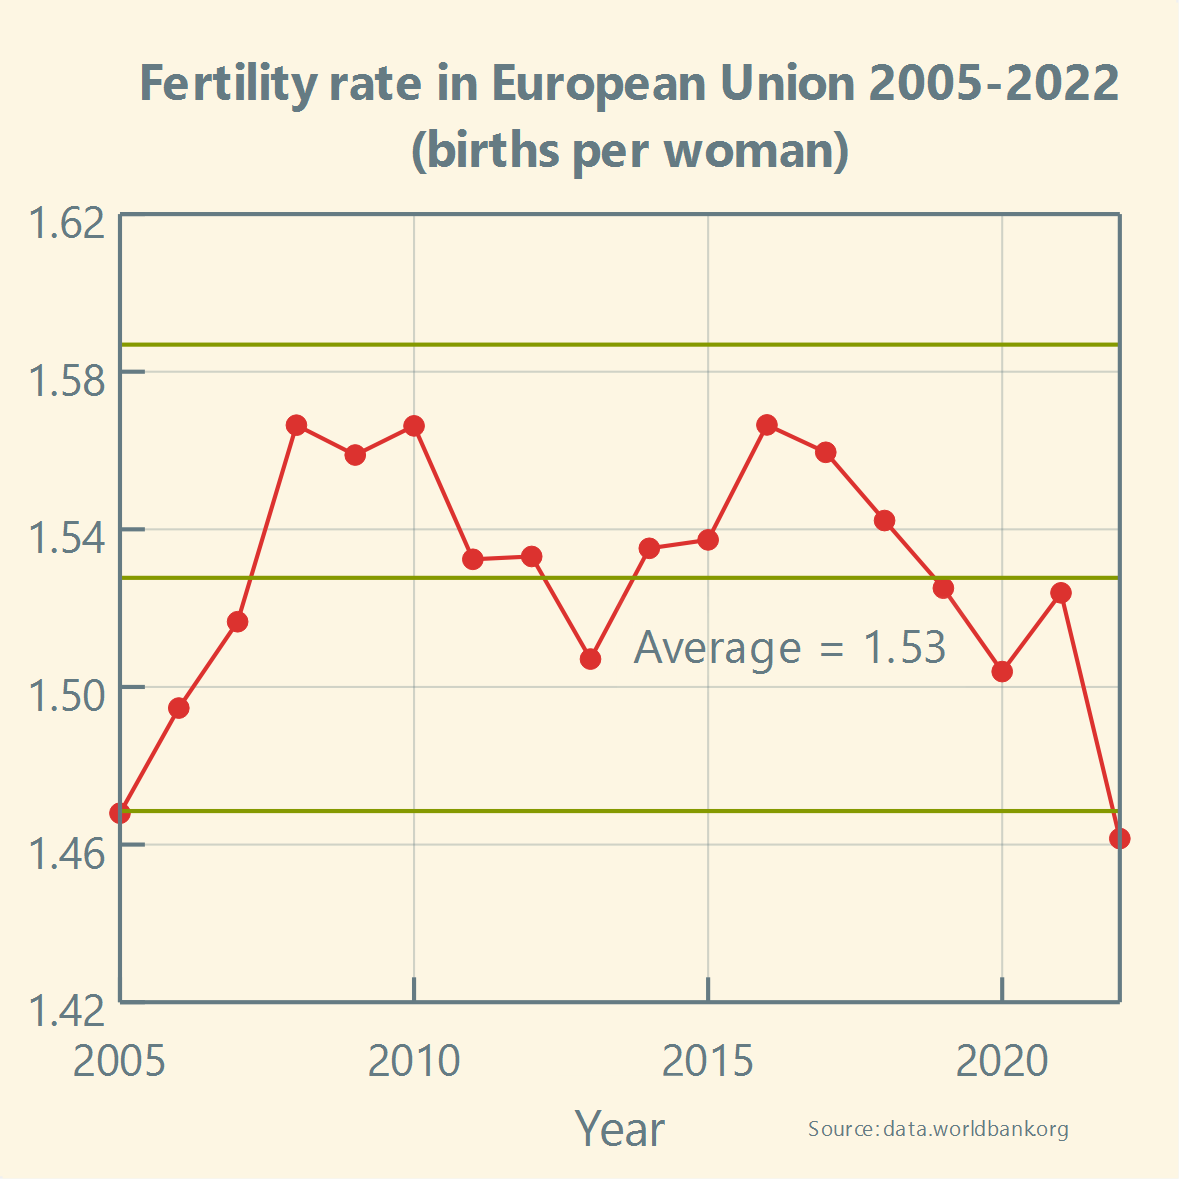
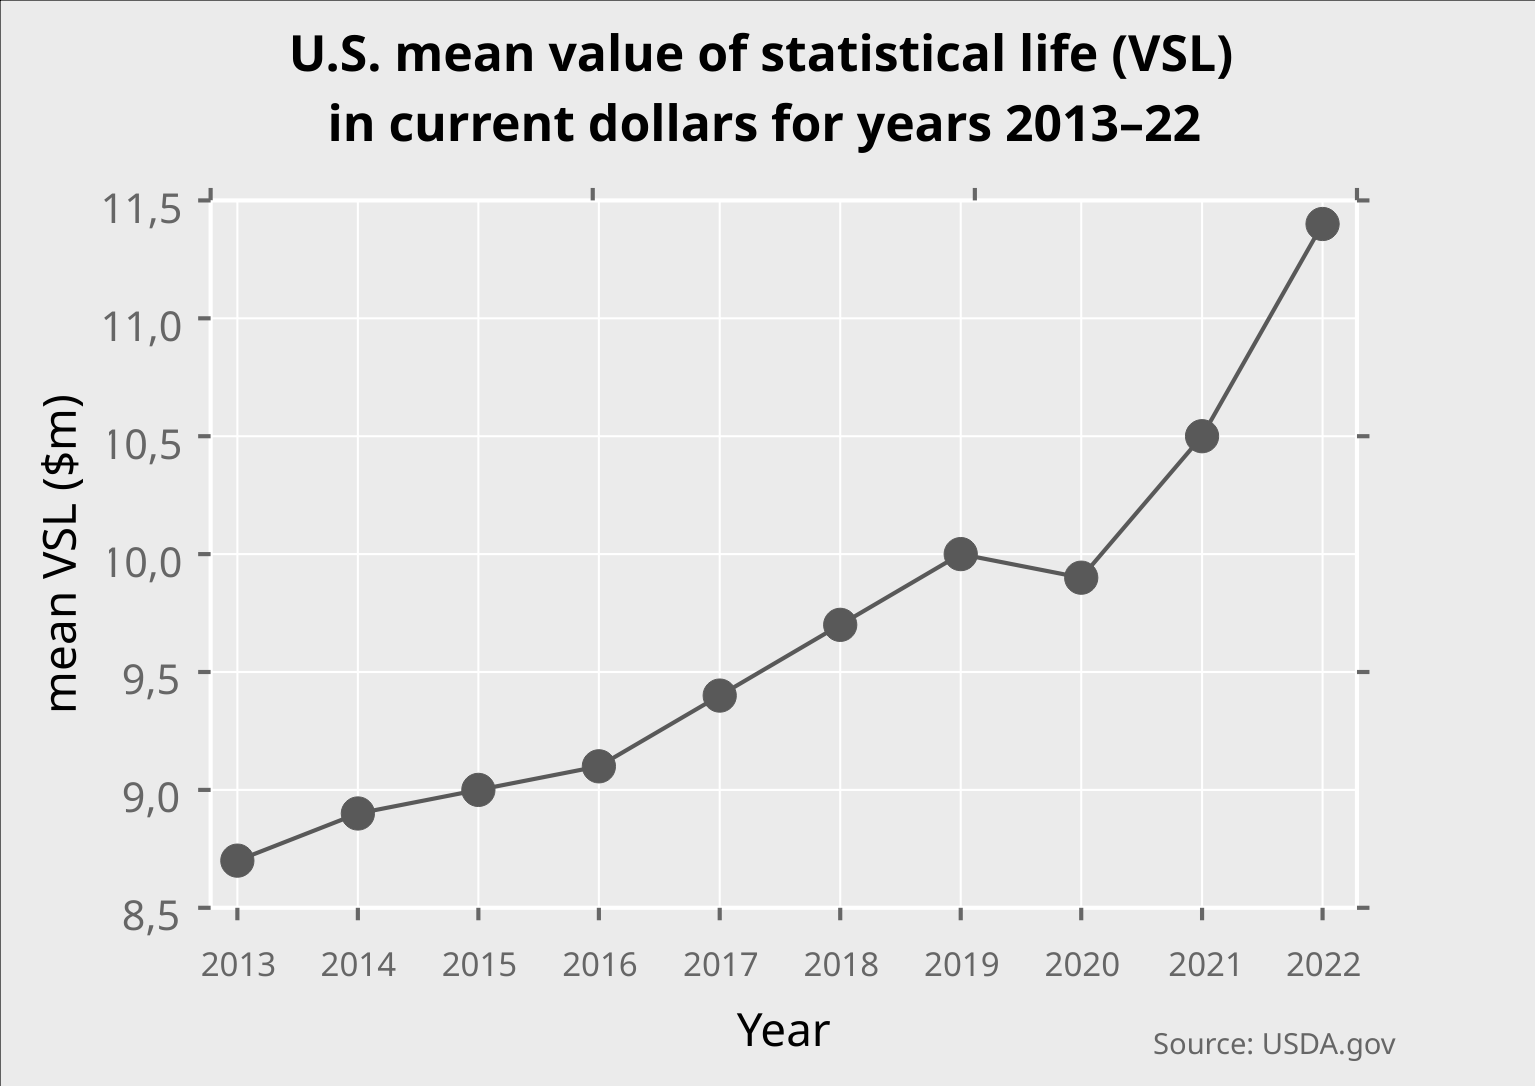
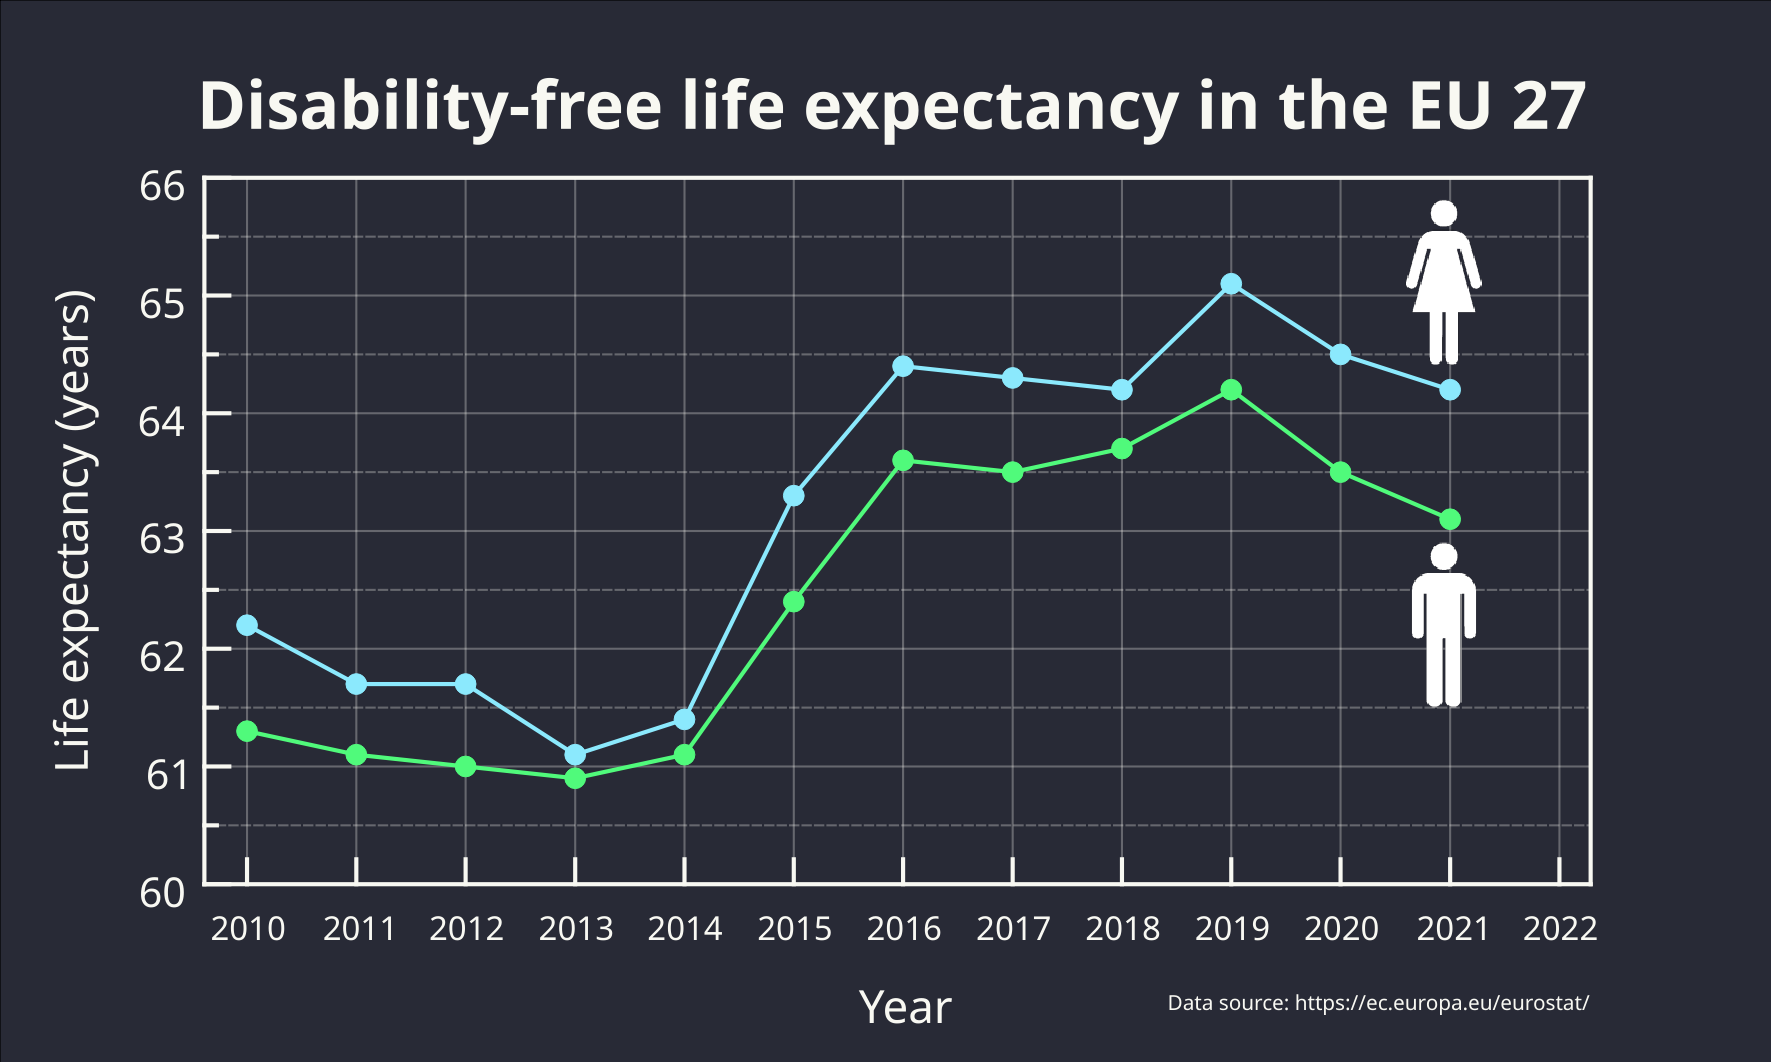
Thank you for your comment. For these types of charts describing variation in data, which also include upper and lower limits on the values that contain probable noise, not using 0 at the start on the y-axis makes sense, as it makes it easier to analyze this variation and detection of potential signals.
We believe that Howard Wainer certainly would not recommend blindly applying this principle to all cases.
@europesays @UnitedStates @labplot@lemmy.kde.social @dataisbeautiful
Has the #FertilityRate in the #US been stable over the past two decades? And how does it compare to the #EU?
Boosts appreciated! :boost_love:🚀
#Europe #Future #EU #Europa #Fertility #Politics #Healthcare #Health #BirthRate #Demography #Population #Biology #News #Community #Statistics #FreeSoftware #OpenSource #ControlChart #LabPlot #Data #dataViz #USA #America #Trump #Musk
@coucouf @europesays @labplot@lemmy.kde.social @dataisbeautiful
Let us reply by quoting Howard Wainer. In his well-known paper “How to Display Data Badly” he wrote:
“A second way to hide the data is in the scale. This corresponds to blowing up the scale (i.e., looking at the data from far away) so that any variation in the data is obscured by the magnitude of the scale. One can justify this practice by appealing to “honesty requires that we start the scale at zero,” or other sorts of sophistry.”
@hanscees @kde @europesays @dataisbeautiful @labplot@lemmy.kde.social
Thank you for your comment. We are just following the definition of the fertility rate by the World Bank Group:
👉 https://data.worldbank.org/indicator/SP.DYN.TFRT.IN?locations=EU
@europesays @labplot@lemmy.kde.social @dataisbeautiful
Simply asking two primary questions to guide any analysis will lead to a better understanding of variation and more effective decision making:
1️⃣ Is the process currently stable?
2️⃣ Based on this knowledge, what type of action makes sense?👉 https://healthleadsusa.org/wp-content/uploads/2018/10/understanding-variation26-years-later.pdf
In this paper Thomas Nolan, Rocco J. Perla and Lloyd Provost explain why correctly assessing #variation is fundamental to sound decisions.
It depends on the expected functionality. You can check the existing features here:
➡️ https://labplot.org/featuresWe are currently working on expanding #LabPlot’s functionality in these areas:
▶️ Live Data Analysis
▶️ #Python Scripting
▶️ Statistical Analysis
▶️ Quality Improvement Charts
 11·5 months ago
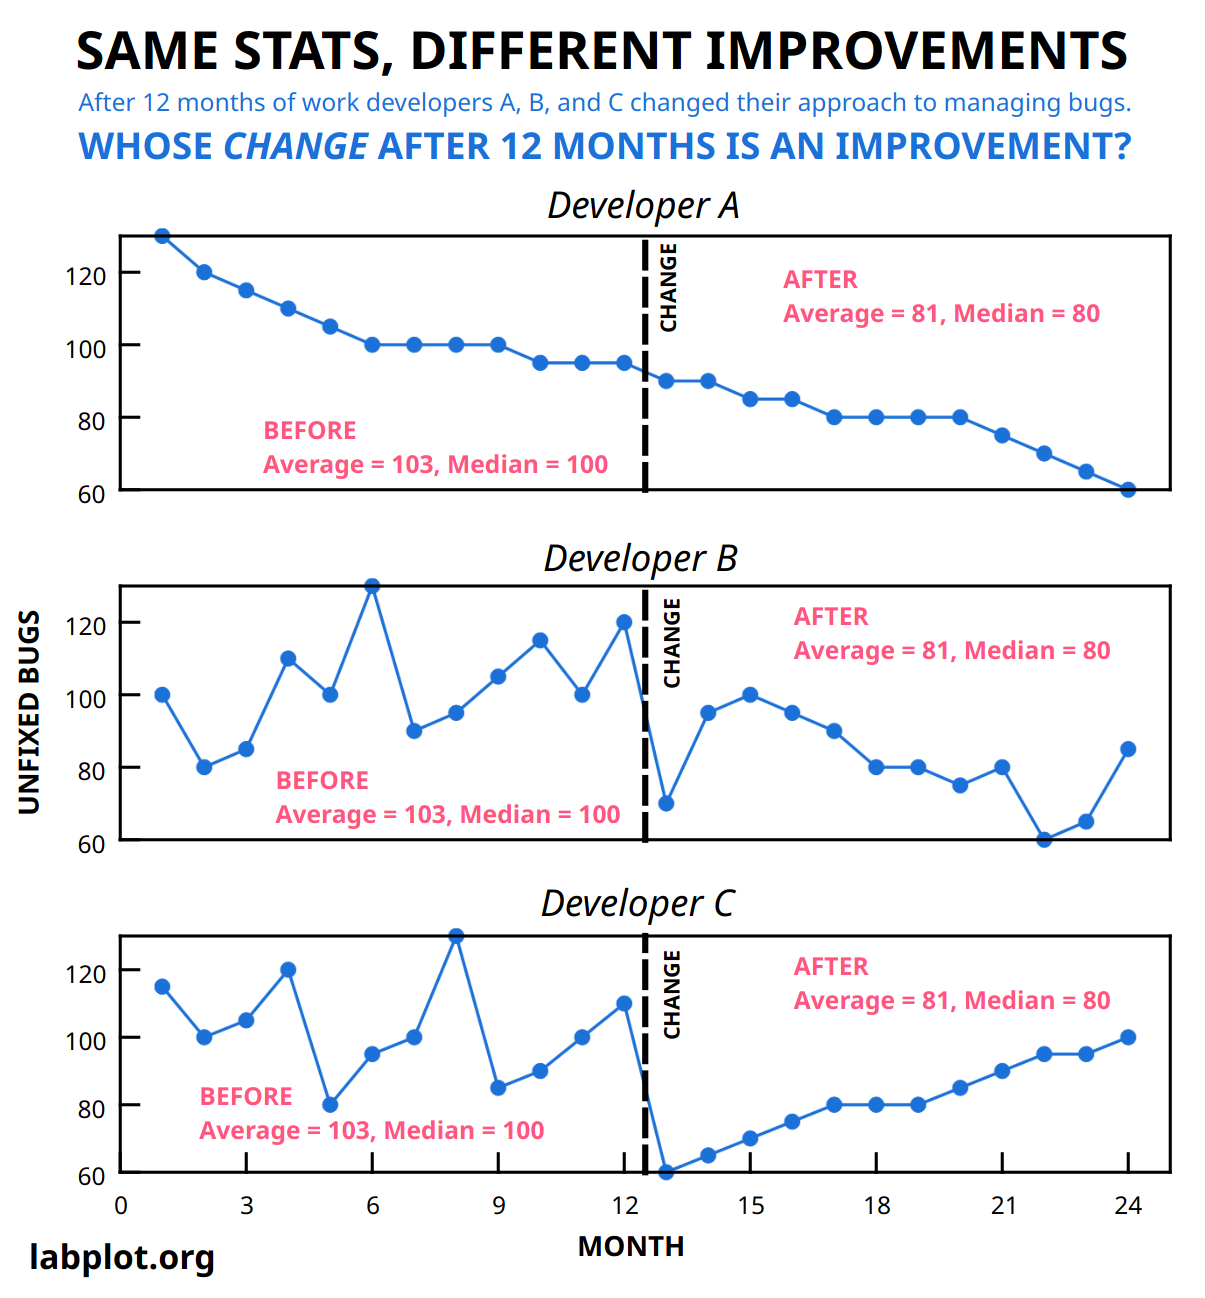
Assuming a steady flow of bugs of the same kind, we share the same line of reasoning.
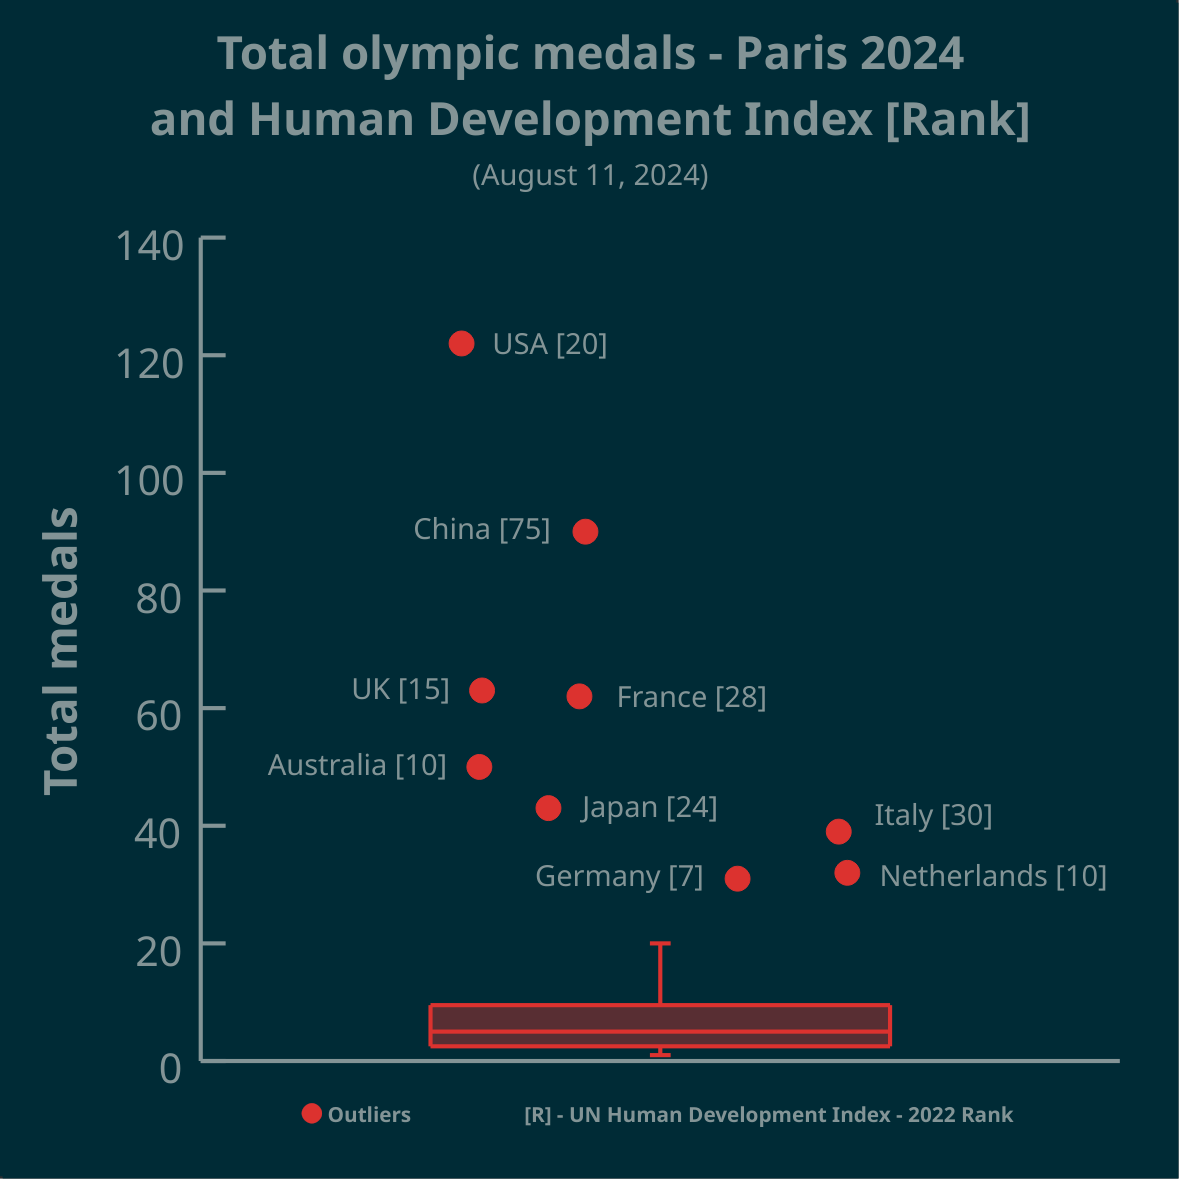
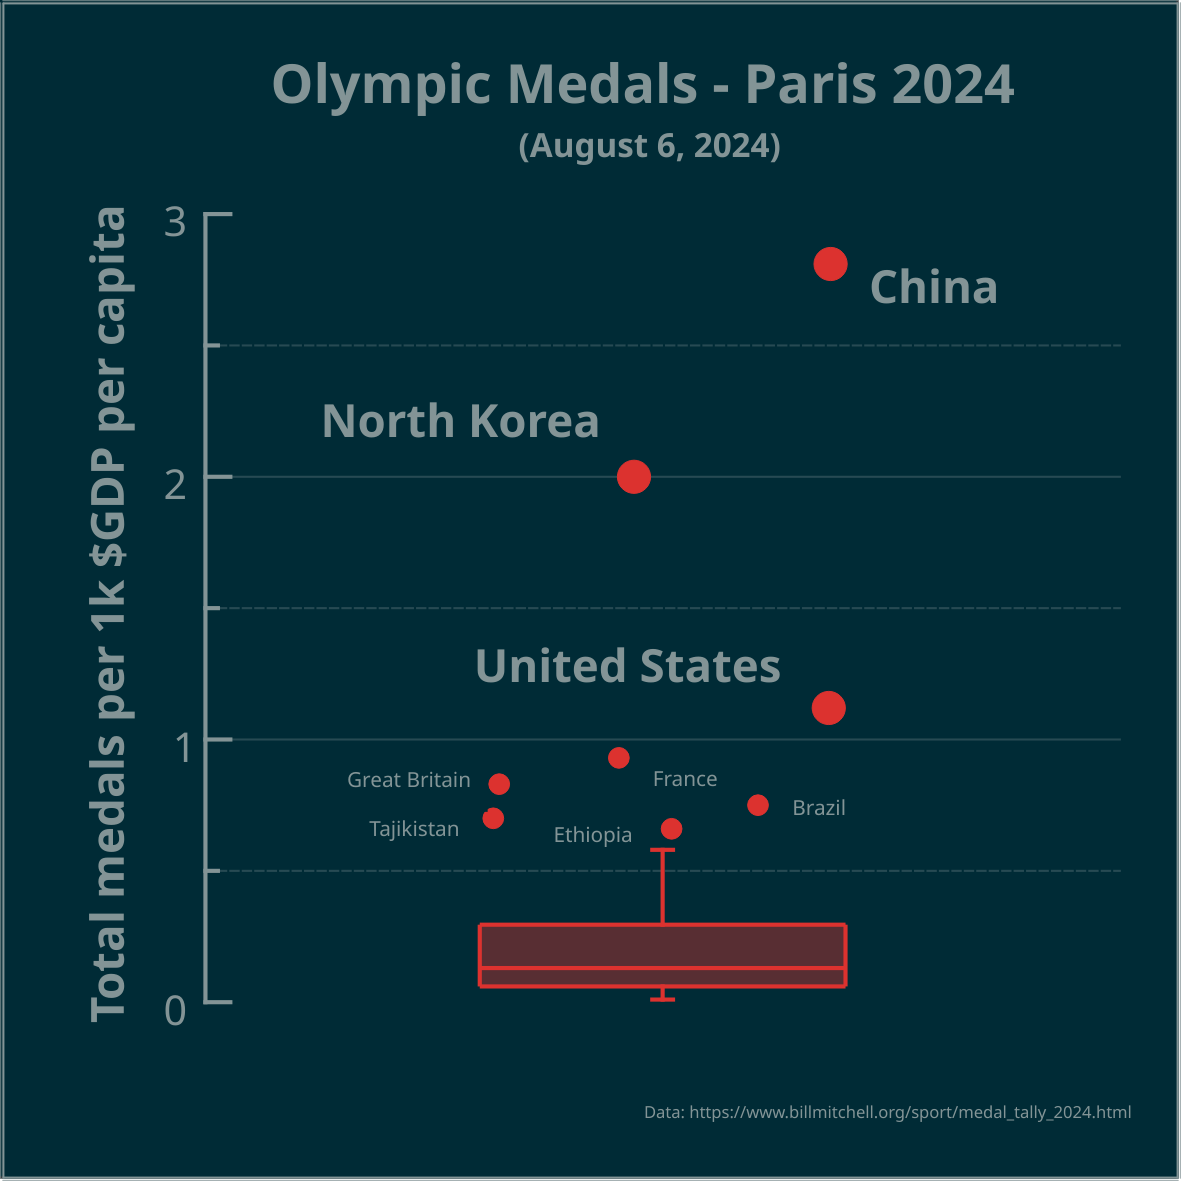
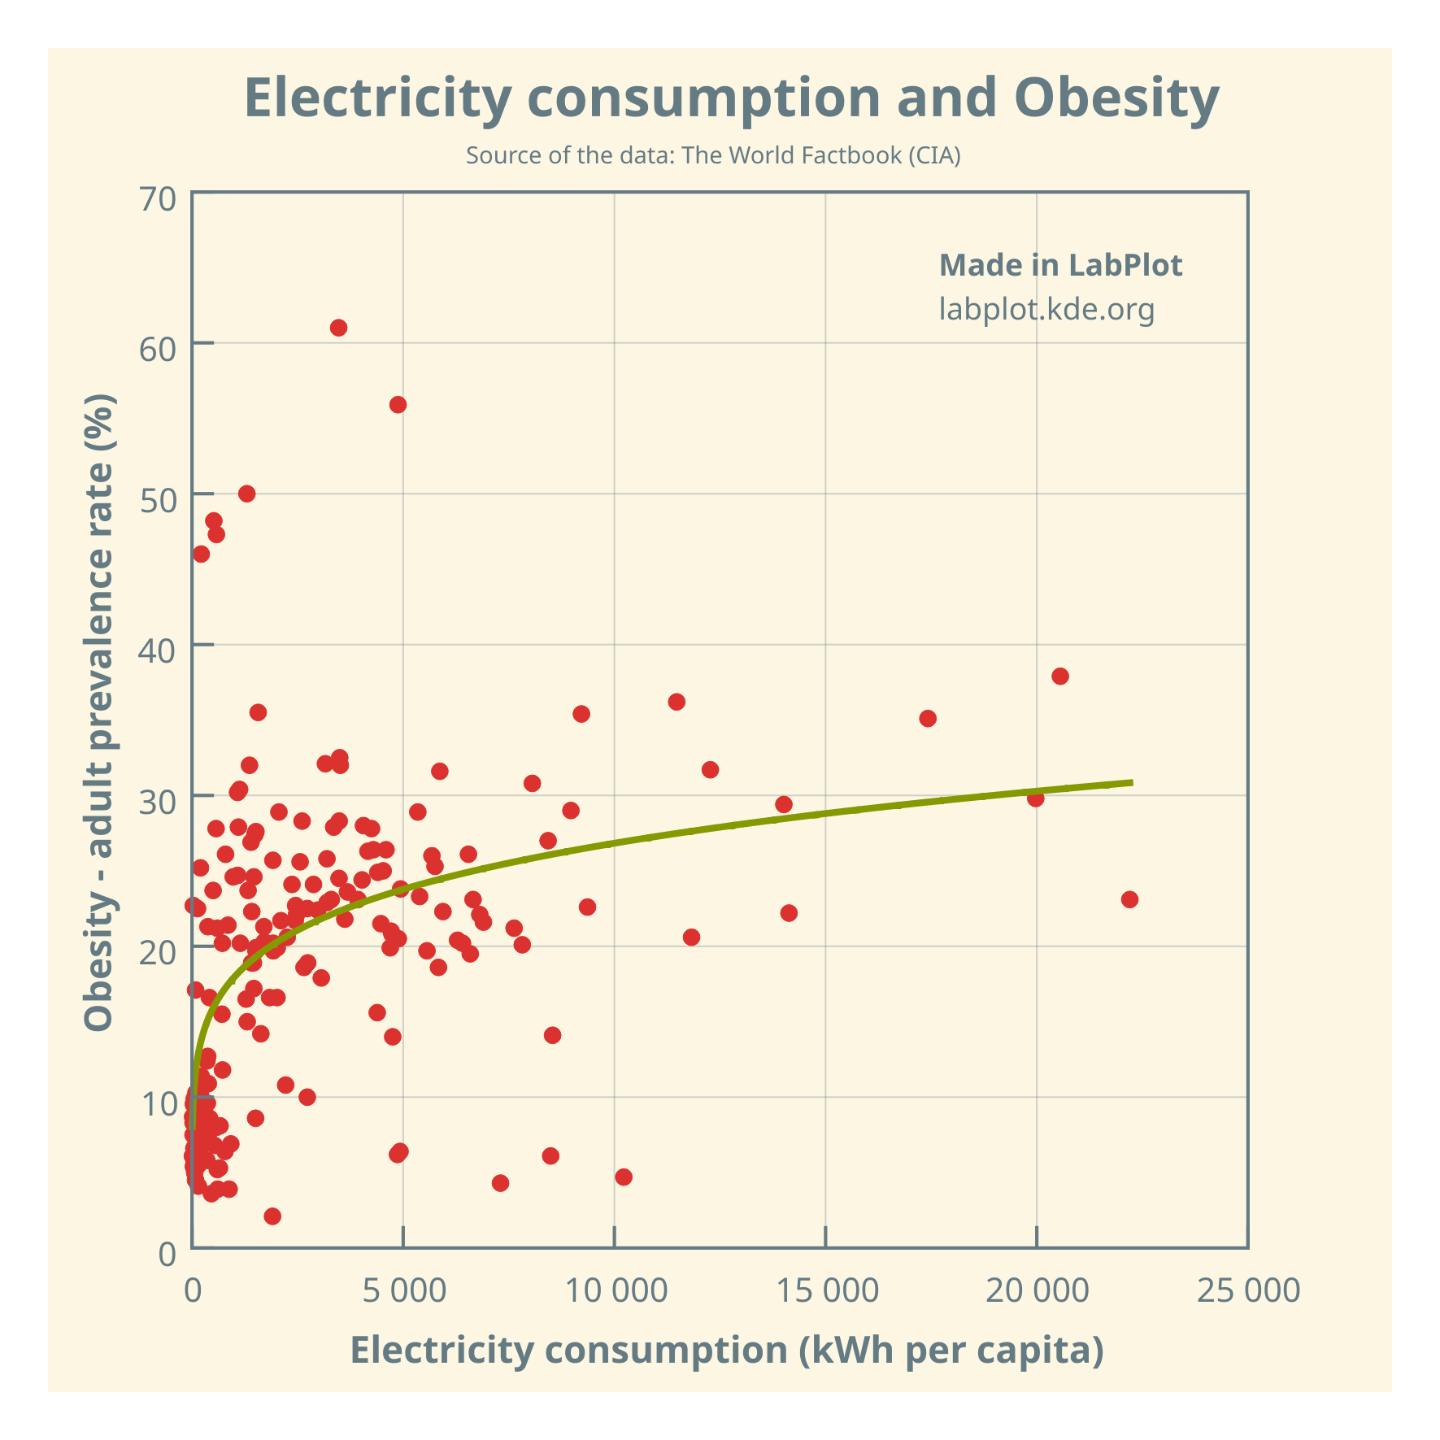
Thank you for all your comments. A jittering of data points along the x-axis was used to avoid over-plotting. But yes, a scatter plot with a boxplot attached along the y-axis (to show outliers) may be more informative in this case.
A boxplot is a 1-dimensional plot. The data points are jittered along the x-axis to make them less crowded.
More on boxplots here:
➡️ https://labplot.kde.org/2021/08/11/box-plot/
➡️ https://userbase.kde.org/LabPlot/2DPlotting/BoxPlot
We used #LabPlot, a free, open source and cross-platform data visualization and analysis software.
LabPlot’s homepage:
➡️ https://labplot.kde.org/Video tutorials:
➡️ https://www.youtube.com/@LabPlot/videos
Great question! And what’s _your_ answer?
Any exploratory plot forms a question and your comment shows how to look for answers. Thanks!
The points are jittered along the x-axis, otherwise the data points could overlap.
Australia is the next country after Ethiopia, but it’s not outlier in this case.
You can read more on boxplots here:

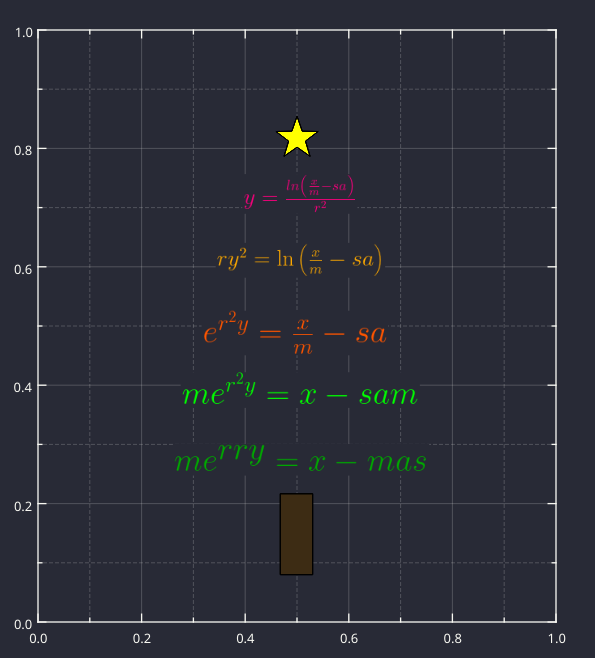
Our Christmas tree includes a test to check if our readers are humans 😉
Let’s just assume that the Christmas tree includes a test to check if our readers are humans 🙂


@IrritableOcelot
Thank you for your feedback. Have a look at LabPlot’s features, esp. the section on data analysis and statistics. More to come soon.
➡️ https://labplot.org/features